
Every company is concerned about its profitability. The service industry faces many challenges and is always on the lookout for ways to improve profitability and utilization of their billable resources (employees). Thus, it is critical for businesses to be able to analyze key metrics, such as billability, profitability, efficiency and utilization of their resources. This information is used in decision-making and planning at the executive level.
The Overview tab of Project Center displays comparison tables, analysis charts and timelines that can enable managers to track the progress of each project.
The following information is available on the Project Center-Overview screen:
Refresh:
Retrieves the latest data from the database and displays it on the screen.
Print:
Opens the Budget Comparison report displaying information about budgeted, spent and remaining values for each project along with the budget status. The preview displays a full screen representation of a report. It provides you with various options: export, print or email report, page setup, printer selection, navigation, modify fonts and items, zoom or sort data, find data, memorize report, etc.
Budget/Contract Comparison:
Depending upon what you select from this drop-down list, it displays comparison tables for cost amount and hours. The Cost table draws up a comparison between contract/budgeted costs, amount spent and remaining amount for the selected project. It gives you a good idea as to whether the project has exceeded the agreed contract amount or has gone over-budget. The negative costs are highlighted in red, thus warning you. When the time and expense evaluation rule is selected for a project, Web Suite evaluates each time and expense entry to determine if the total amount spent exceeds the contract amount.
Total Amount Spent = Value of all time and expense entries (both billable and non-billable), excluding extras.
Similarly, the Hours table draws up a comparison between budgeted, spent and remaining hours for the selected project. It gives you a good idea as to whether the project has exceeded the allocated hours or not. The negative values are highlighted in red, thus warning you. You can view the allocation details on the Allocate tab.
Profit and Billability Analysis
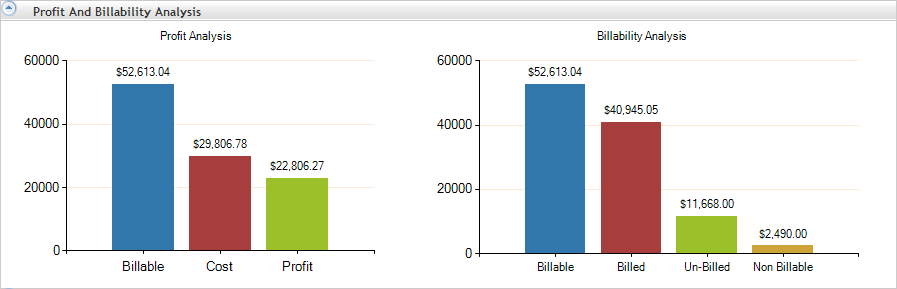
Profit Analysis:
Displays a bar chart with such elements that can help you in analyzing your profit (or loss) on each project. You can see a breakdown of these elements in terms of billable services and expenses, actual costs and dollar profit/loss. Upon comparison of the billable amount with the cost incurred on the project, you can view the resulting gross profit or loss.
Billability Analysis:
Displays a bar chart with such elements that can help you in analyzing the billability and productivity of each project. You can see a breakdown of these elements in terms of billable, billed, unbilled and non-billable values. Upon comparison of the billable amount with the billed amount for the project, you get a good idea as to how much has been earned on a project and what is in the pipeline.
During analysis, the key indicator to check is the difference between the total billings and total collections. If it is 10% or less, that is normal. However, a red flag should go up when the difference is greater than 10% of billings. Be sure to adjust your analysis for normal collection cycles and seasonal billing factors.
Earned Value and Efficiency
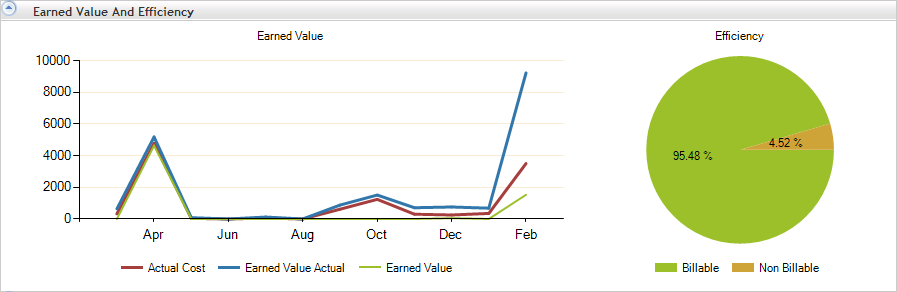
Earned Value:
Displays a line chart with such elements that can help you in analyzing each project's performance. You can see a breakdown of these elements in terms of earned value, earned value actual and actual cost. Actual Cost is the actual cost of work done so far and is calculated as a sum of cost amount of services and expenses; Earned Value Actual is the actual amount of work done so far and is calculated as sum of billable services and expenses; while the Earned Value is the amount of work billed so far and is calculated as the sum of invoice amount billed.
With this, executives and managers receive concise and timely information about project's progress, enabling forecasting and resolution of issues (like cost management, scheduling, etc.). Comparing the estimated and actual values, possible ‘red flags’ can be identified when the estimated percent complete and actual time and expenses burned (charged to the project) differ significantly.
Efficiency:
Displays a pie chart with such elements that can help you in analyzing your efficiency on each project. You can see a breakdown of these elements in terms of billable and non-billable services and expenses. Upon comparison of the billable percentage (or amount) with the non-billable values, you can get a good idea about the efficiency of your resources. In general, efficiency can be measured quantitatively by the ratio of output to input. While making decisions, this information helps you to identify the weak areas and then make improvement plans (like skill improvement training and development of employees).
Timeline
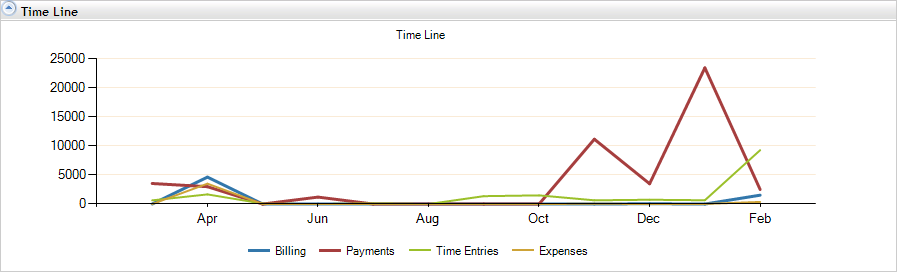
It displays a line chart with such elements that can help you in tracking the progress of your project. You can see a breakdown of these elements in terms of billings, payments, time entries and expenses incurred over a period of last 12 months. Upon comparison of these amounts with the contract amount spent, you can evaluate the progress of your project.